- Trading
- Trading
- Markets
- Markets
- Accounts
- Accounts
- Platforms & tools
- Platforms & tools
- Platforms
- Platforms
- Premium trading tools
- Premium trading tools
- Education
- Education
- Resources
- Resources
- Courses
- Courses
- Help & support
- Help & support
- About
- About
- Client support
- Trading
- Trading
- Markets
- Markets
- Accounts
- Accounts
- Platforms & tools
- Platforms & tools
- Platforms
- Platforms
- Premium trading tools
- Premium trading tools
- Education
- Education
- Resources
- Resources
- Courses
- Courses
- Help & support
- Help & support
- About
- About
- Client support
 News & Analysis
Natural Gas – technical analysis
8 September 2022The United States used 30.28 trillion cubic feet of natural gas in 2021, making them the world’s largest consumer of natural gas. Natural gas consumption in the United States has two seasonal peaks, largely reflecting weather-related fluctuations in energy demand. One of the biggest consumptions of gas is industrial, residential and commercial cooling and heating systems (eia, 2022).
As the world’s largest user of natural gas transitions out of summer, will this change indicate a decrease of their natural gas consumption?
Could the decrease in demand for cooling be reflected on the technical charts?
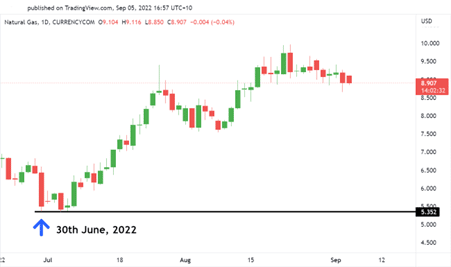
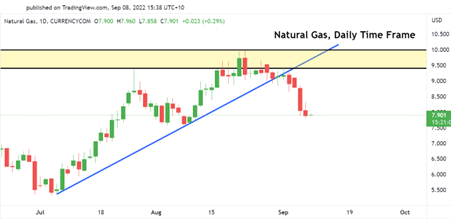
On a daily timeframe, natural gas has been on a steady upward trend since the end of June, in tandem with the beginning of summer in the US (seen on the chart below).
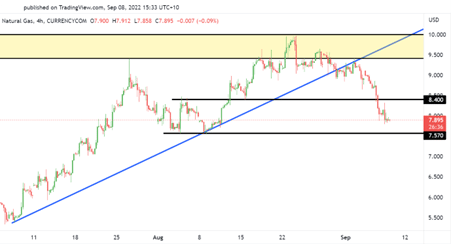
A trendline from the beginning of that trend until now can be drawn, and we can see recently that line has been broken by a daily candlestick, closing below the trendline which can indicate a change in trend for natural gas.
After the strong break below of the trendline followed by multiple bearish daily candlesticks, we can consequently expect further downside movement for natural gas, after breaking through a strong support at $8.4, in all probability with natural gas currently sitting at $7.895 we could see natural gas come down to the next support level around $7.57.
Ready to start trading?
Disclaimer: Articles are from GO Markets analysts and contributors and are based on their independent analysis or personal experiences. Views, opinions or trading styles expressed are their own, and should not be taken as either representative of or shared by GO Markets. Advice, if any, is of a ‘general’ nature and not based on your personal objectives, financial situation or needs. Consider how appropriate the advice, if any, is to your objectives, financial situation and needs, before acting on the advice. If the advice relates to acquiring a particular financial product, you should obtain and consider the Product Disclosure Statement (PDS) and Financial Services Guide (FSG) for that product before making any decisions.
Next Article
Equities market rebounds after recent sell off
The equities market rebounded strongly after bulls pulled back all the losses from the prior week of trading. Much of the gains were associated with a drop in the strength of the US dollar which retraced after its insane run. The Dow Jones, Nasdaq, and S&P 500 all finished the trading week exceptionally strong rising 2.65%, 4.05% and 3.65%, res...
September 12, 2022Read More >Previous Article
Oil Price tumbles to 7 month lows as recession fears grow
Brent Crude and West Texas Intermediate Oil both fell to their lowest levels since January as fresh recession fears swept the market. Brent dropped to...
September 8, 2022Read More >
- Trading
- Trading
- Trading
- Markets
- Markets
- Accounts
- Accounts
- Platforms & tools
- Platforms & tools
- Platforms
- Platforms
- Premium trading tools
- Premium trading tools
- Education
- Education
- Resources
- Resources
- Courses
- Courses
- Help & support
- Help & support
- About
- About
- Client support