- Trading
- Trading
- Markets
- Markets
- Products
- Forex
- Commodities
- Metals
- Indices
- Shares
- Cryptocurrencies
- Treasuries
- ETFs
- Accounts
- Accounts
- Compare our accounts
- Open account
- Try free demo
- GO Markets Social
- Platforms & tools
- Platforms & tools
- Platforms
- Platforms
- Platforms overview
- MetaTrader 4
- MetaTrader 5
- Mobile trading platforms
- Premium trading tools
- Premium trading tools
- Tools overview
- VPS
- Genesis
- Education
- Education
- Resources
- Resources
- News & analysis
- Education hub
- Economic calendar
- Earnings announcements
- Help & support
- Help & support
- About
- About
- About GO Markets
- Our awards
- Sponsorships
- Client support
- Client support
- Contact us
- FAQs
- Quick support
- Holiday trading hours
- Maintenance Schedule
- Fraud and scam awareness
- Legal documents
- Trading
- Trading
- Markets
- Markets
- Products
- Forex
- Commodities
- Metals
- Indices
- Shares
- Cryptocurrencies
- Treasuries
- ETFs
- Accounts
- Accounts
- Compare our accounts
- Open account
- Try free demo
- GO Markets Social
- Platforms & tools
- Platforms & tools
- Platforms
- Platforms
- Platforms overview
- MetaTrader 4
- MetaTrader 5
- Mobile trading platforms
- Premium trading tools
- Premium trading tools
- Tools overview
- VPS
- Genesis
- Education
- Education
- Resources
- Resources
- News & analysis
- Education hub
- Economic calendar
- Earnings announcements
- Help & support
- Help & support
- About
- About
- About GO Markets
- Our awards
- Sponsorships
- Client support
- Client support
- Contact us
- FAQs
- Quick support
- Holiday trading hours
- Maintenance Schedule
- Fraud and scam awareness
- Legal documents
- Home
- News & Analysis
- Articles
- Forex
- Snapshot – NZDCAD, EURUSD, USOIL
News & Analysis
NZDCAD – Daily
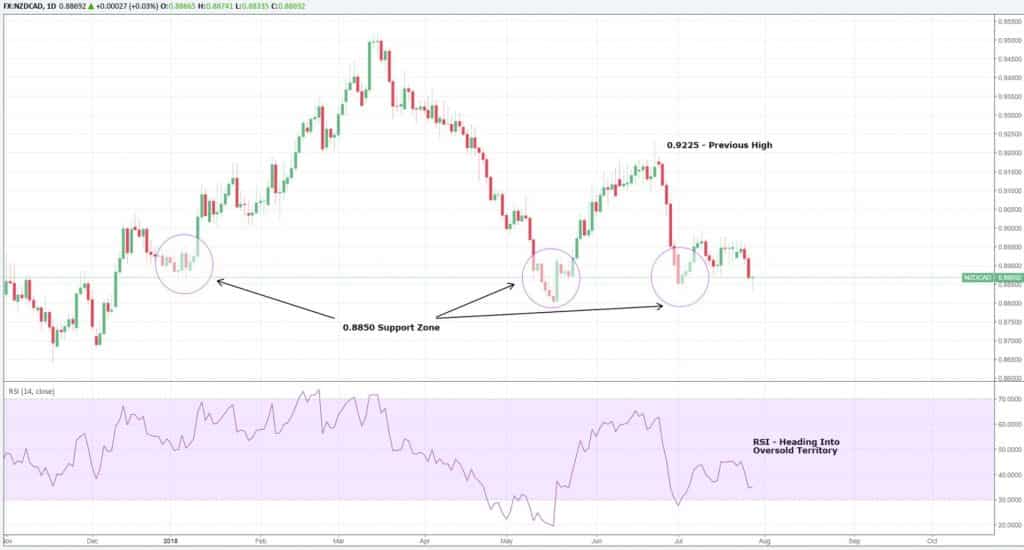
To begin with, let’s take a look at the NZDCAD. Admittedly not the liveliest minor pair but in this instance, I think it is worth a mention. On the daily time frame, we can see the price is hovering around the critical support zone of 0.8850, an area that has been tested three times already this year but has failed to mount any significant challenges to the downside.
The latest candle suggests the bulls are attempting to regain control and we may see moves up to re-test previous areas of resistance. A potential catalyst for a bounce is lurking within the RSI indicator which shows NZDCAD heading into oversold territory.
Upside targets start at 0.90 before testing the previous high of 0.9225.
Should the 0.8850 regions become unstuck, evidence of previous support is around last December’s lows of 0.87EURUSD – Daily
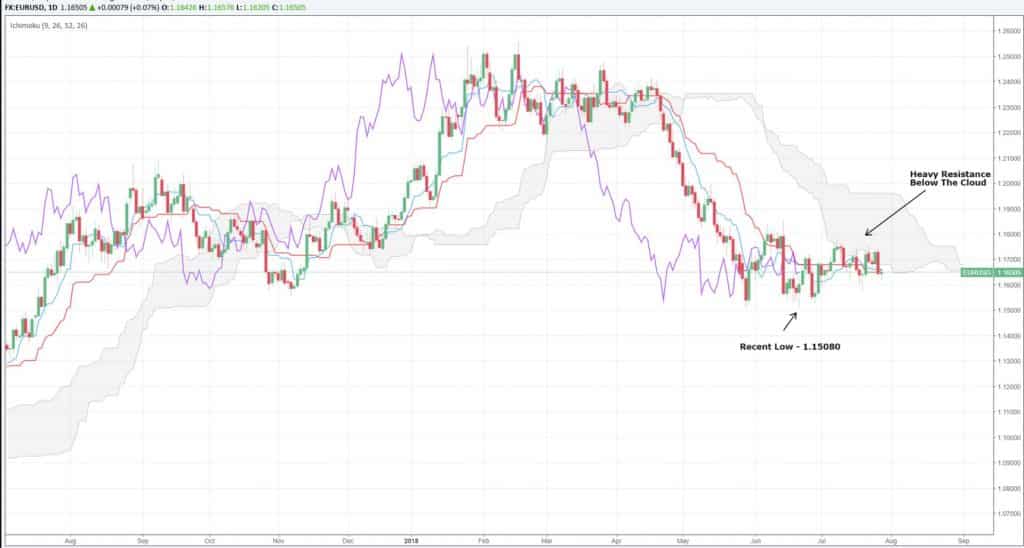
Not a great deal to discuss for the pair during this period of consolidation. However, it is interesting to see how price action is responding to the lower levels of the Ichimoku cloud shown above.
Notice several recent attempts under the cloud before causing temporary reversals each time. All the other indicators on this daily chart including the lagging Chikou Span (purple line) are bearish.
At this point, we could see price retrace back to the previous low of 1.15080 before resuming an upward trajectory longer-term. I say this tentatively because if you look at the weekly chart, the price has not closed above the 200 EMA for the past seven weeks.
USOIL- Daily
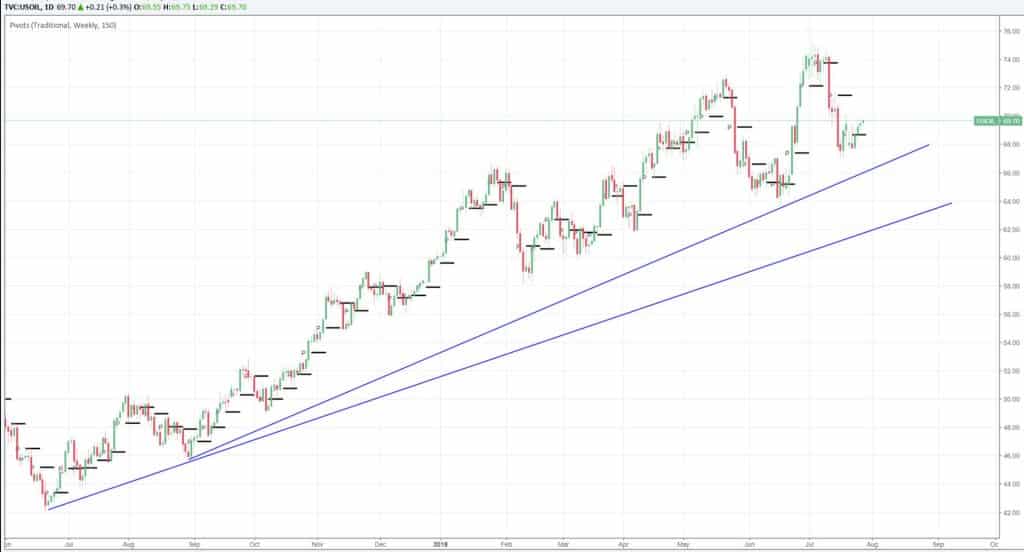
Lastly, without delving into the fundamental drivers of the commodity, displayed is the strong uptrend we have witnessed during the July to September period last year. Technically speaking, we require at least three points of reference to validate these lines, so confirmation is pending.
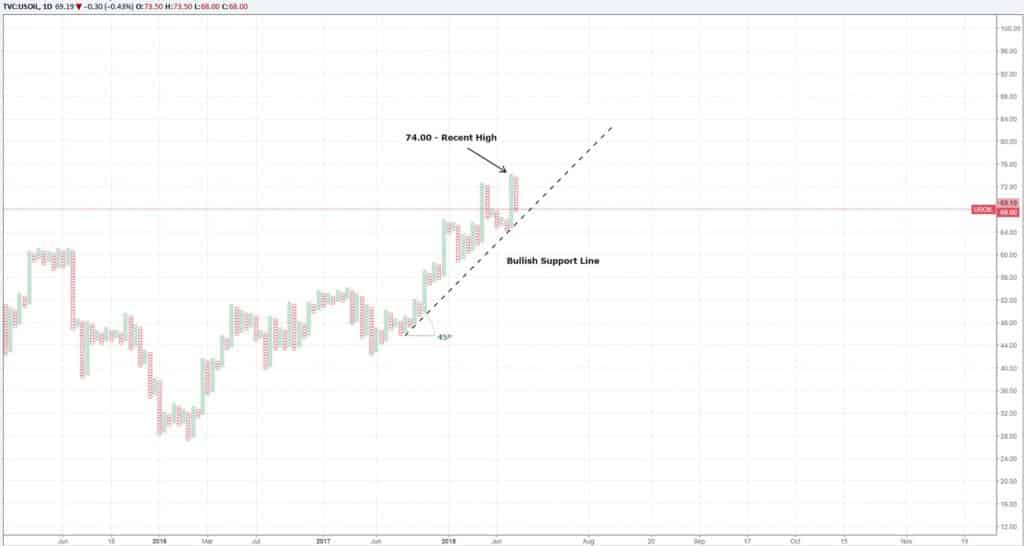
There are also two weekly pivots in the region of 72.00 which could be the next port of call for the price of oil. Above here, we are likely to see 74.00 tested as well. I think the point and figure chart below displays this more clearly. We have a bullish support line that remains steadfast, and the price is edging upwards to re-touch the 74.00 mark. In both charts, it would seem 68.00 is the level to watch before revising the overall trend. It is also worthy of a downside target in the interim.
By Adam Taylor CFTe
This article is written by a GO Markets Analyst and is based on their independent analysis. They remain fully responsible for the views expressed as well as any remaining error or omissions. Trading Forex and Derivatives carries a high level of risk.
Ready to start trading?
Disclaimer: Articles are from GO Markets analysts and contributors and are based on their independent analysis or personal experiences. Views, opinions or trading styles expressed are their own, and should not be taken as either representative of or shared by GO Markets. Advice, if any, is of a ‘general’ nature and not based on your personal objectives, financial situation or needs. Consider how appropriate the advice, if any, is to your objectives, financial situation and needs, before acting on the advice. If the advice relates to acquiring a particular financial product, you should obtain and consider the Product Disclosure Statement (PDS) and Financial Services Guide (FSG) for that product before making any decisions.
Next Article
World’s Largest Stock Exchanges
Almost every country in the world has a stock exchange with some countries having multiple exchanges. There are over 60 major exchanges across the globe with the total market cap of over $85 trillion. But only 18 of those are in the so-called ''$1 trillion club''. The top 18 stock exchanges have a total value of $77 trillion which makes up around 9...
July 30, 2018Read More >Previous Article
Monitoring Volatility and Spotting Trading Opportunities
US Markets With relatively sound fundamentals driven by strong earnings growth so far in this earning season, US equity markets have continued their b...
July 25, 2018Read More >


