- Trading
- Trading
- Markets
- Markets
- Accounts
- Accounts
- Platforms & tools
- Platforms & tools
- Platforms
- Platforms
- Premium trading tools
- Premium trading tools
- Education
- Education
- Resources
- Resources
- Courses
- Courses
- Help & support
- Help & support
- About
- About
- Client support
- Trading
- Trading
- Markets
- Markets
- Accounts
- Accounts
- Platforms & tools
- Platforms & tools
- Platforms
- Platforms
- Premium trading tools
- Premium trading tools
- Education
- Education
- Resources
- Resources
- Courses
- Courses
- Help & support
- Help & support
- About
- About
- Client support
 News & Analysis
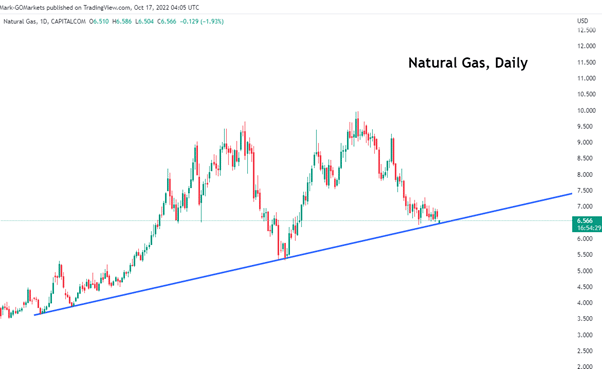
Natural Gas – Technical Analysis
18 October 2022Natural gas has fallen roughly 30% since the start of September, and has now landed on a daily trend line. Taking a look at the last couple of weeks of price action, natural gas has been consolidating between $6.5 to $7.3 for the last 3 weeks as it decides on the next move.
Analysing the area that natural gas is currently sitting on, there is a major daily support/resistance area between $6.4 to $6.6 as seen below, highlighted in yellow:
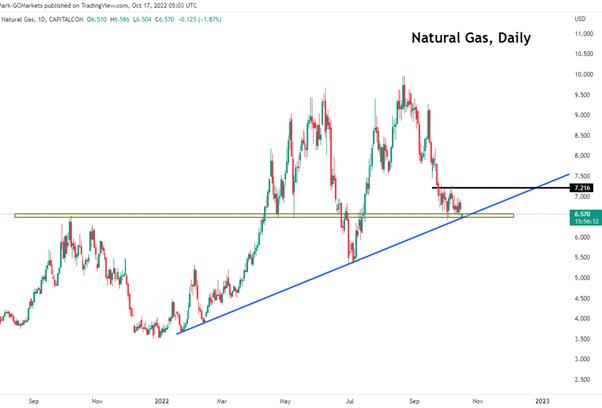
As natural gas bounces between the daily consolidation range, a break above the range (marked with a black horizontal line) could indicate a move to the upside, where the next resistance level is around $7.55, however if natural gas breaks below the trend line, the next support sits around $6.
Disclaimer: Articles are from GO Markets analysts and contributors and are based on their independent analysis or personal experiences. Views, opinions or trading styles expressed are their own, and should not be taken as either representative of or shared by GO Markets. Advice, if any, is of a ‘general’ nature and not based on your personal objectives, financial situation or needs. Consider how appropriate the advice, if any, is to your objectives, financial situation and needs, before acting on the advice. If the advice relates to acquiring a particular financial product, you should obtain and consider the Product Disclosure Statement (PDS) and Financial Services Guide (FSG) for that product before making any decisions.
Next Article
US stocks rally, Dollar slides as markets turns risk on amid UK fiscal U-turn and positive US earnings
US stocks soared in Monday’s session in an epic short squeeze as markets turned risk-on after new UK Chancellor pivoted on proposed tax cuts that had roiled UK bond markets and Strong bank earnings from the US calmed recession fears. The Dow Jones finished the session up 1.86% , with the tech and growth heavy Nasdaq outperforming, up 3.43% und...
October 18, 2022Read More >Previous Article
What is mean reversion?
Mean reversion strategies are some of the simplest trading strategy’s used by sophisticated traders. However, when most traders hear the term, they ...
October 18, 2022Read More >
- Trading
- Trading
- Trading
- Markets
- Markets
- Accounts
- Accounts
- Platforms & tools
- Platforms & tools
- Platforms
- Platforms
- Premium trading tools
- Premium trading tools
- Education
- Education
- Resources
- Resources
- Courses
- Courses
- Help & support
- Help & support
- About
- About
- Client support